Top Causes of Motor Vehicle Accidents in Philadelphia
Philadelphia’s worst crashes aren’t spread evenly across the city. They cluster on a small share of streets, especially along what the city calls its High Injury Network. Speed, aggressive driving, and dangerous turning movements combine there to produce the most severe outcomes.
The city’s Vision Zero initiative reports that this network covers just 12% of Philadelphia’s streets, yet it accounts for 80% of fatal and serious injury crashes. Understanding why crashes concentrate there explains Philadelphia’s traffic safety problem as a whole.
The danger isn’t random, and it isn’t just “more cars.” Fast-moving traffic, complex intersections, and vulnerable road users interact on streets built decades ago for far less traffic and lower speeds. Below, we break down the top causes behind Philadelphia’s three major crash categories — vehicle-to-vehicle, vehicle-to-pedestrian, and vehicle-to-bicycle — along with where the city is seeing results.
Vehicle-vs-Vehicle Crashes: The Leading Causes Are Turning Movements and Aggressive Driving
When two vehicles collide in Philadelphia, intersection collisions cause most of the severe outcomes — especially ones involving a turning movement. The city’s Vision Zero Annual Report 2024 identifies angle crashes, which happen when one vehicle strikes another at an intersection, often while turning. Angle crashes rank as one of the two most common severe crash types in Philadelphia, alongside crashes involving pedestrians.
Angle crashes are rarely a matter of bad luck. A specific set of driver behaviors typically causes them: failing to yield the right of way, running red lights or stop signs, making unprotected left turns without adequate gaps in traffic, or entering an intersection too fast to react to cross-traffic.
The city has flagged one behavioral trend as a growing cause: aggressive driving. Officials say it has risen since 2020 and now drives more than one-third of all traffic-related deaths in Philadelphia.
Intersections concentrate the city’s traffic risk. Speeding into a yellow light, rolling a stop sign, or forcing a turn before oncoming traffic clears — these behaviors turn an intersection into a crash site, and drivers can prevent most of them.
Vehicle-vs-Pedestrian Crashes: The Most Dangerous, and Most Common, Cause of Traffic Death
Pedestrian crashes deserve the most urgent attention of any category in Philadelphia traffic safety. The city’s 2024 Vision Zero report shows that deaths among people walking and rolling rose 65% compared to the 2015–2019 average — a sharp and troubling increase.
Speed is the clearest reason these crashes turn fatal so often. The city’s own data makes this stark: when a vehicle strikes a pedestrian, cyclist, or other vulnerable road user at 20 mph, roughly 1 in 10 die. At 40 mph, that number jumps to 9 in 10.
That statistic turns “speeding” from a generic traffic violation into what it actually is: the single biggest factor in whether a pedestrian survives a crash. It’s why Philadelphia’s Vision Zero strategy leans so heavily on lowering operating speeds through traffic calming, redesigned intersections, and automated enforcement. The city treats these tools as the primary lever for reducing pedestrian deaths — not driver awareness campaigns alone.
Citywide numbers reflect the same problem. Philadelphia recorded 123 traffic fatalities in 2023. The share of severe crashes that ended in death rose to 29% that year, up from 17% in 2019 — a sign that crashes are becoming more lethal, not just more frequent.
Vehicle-vs-Bicycle Crashes: A Distinct Set of Causes
Bicycle crashes deserve their own category instead of folding entirely into “pedestrian” statistics, because the causes and crash mechanics genuinely differ. Speed and crossing conflicts dominate pedestrian crashes. Turning conflicts with vehicles, dooring incidents, unsafe passing, and blocked or compromised bike lanes shape bicycle crashes instead, often forcing cyclists into mixed traffic.
Cyclists remain a meaningful share of the city’s traffic fatalities. Philadelphia recorded 10 bicyclist deaths in 2023, and one analysis estimated an average of 2.5 fatal bicycle crashes per million residents between 2017 and 2021.
Bicycle crash data also has a gap worth noting. Cities often undercount bicycle crashes or fold them into broader crash categories, which understates the real risk cyclists face on Philadelphia streets..
The Root Cause Behind the Pattern: Street Design, Not Just Driver Behavior
Philadelphia’s crash data reveals a root cause behind this pattern: severe outcomes cluster on a specific, identifiable set of streets rather than spreading evenly across the city. The city’s High Injury Network concept captures this directly — just 12% of Philadelphia’s streets account for 80% of fatal and serious injury crashes.
This matters because it shifts the conversation. Instead of blaming distracted or aggressive drivers everywhere, it points to specific corridors built in ways that make crashes more likely and more severe.
Philadelphia has identified interventions that appear to work on these high-risk corridors: speed cameras, median islands, and intersection redesigns among them. Officials specifically highlight Roosevelt Boulevard, where speed camera enforcement significantly cut speeding and lowered pedestrian-involved crashes at monitored locations.
That’s an important note to end on. Philadelphia’s crash problem isn’t just a story about bad drivers — it’s a story about which causes are preventable, and which interventions reduce risk when the city applies them to the right streets.
What to Do If You’re Involved in a Crash
Understanding why these crashes happen doesn’t change what to do if you’re in one. Determining the cause — another driver’s behavior, or a hazard in the roadway itself — can affect who’s responsible and what options you have. That’s not always obvious from the scene of a crash.
If you’ve been involved in a motor vehicle accident in Philadelphia, consider speaking with a personal injury attorney before dealing with insurance companies on your own. An attorney can help you understand your rights, the relevant deadlines, and what the cause of your specific crash means for your case.
Been in a crash? Contact us today for a free consultation.
The Top Causes at a Glance
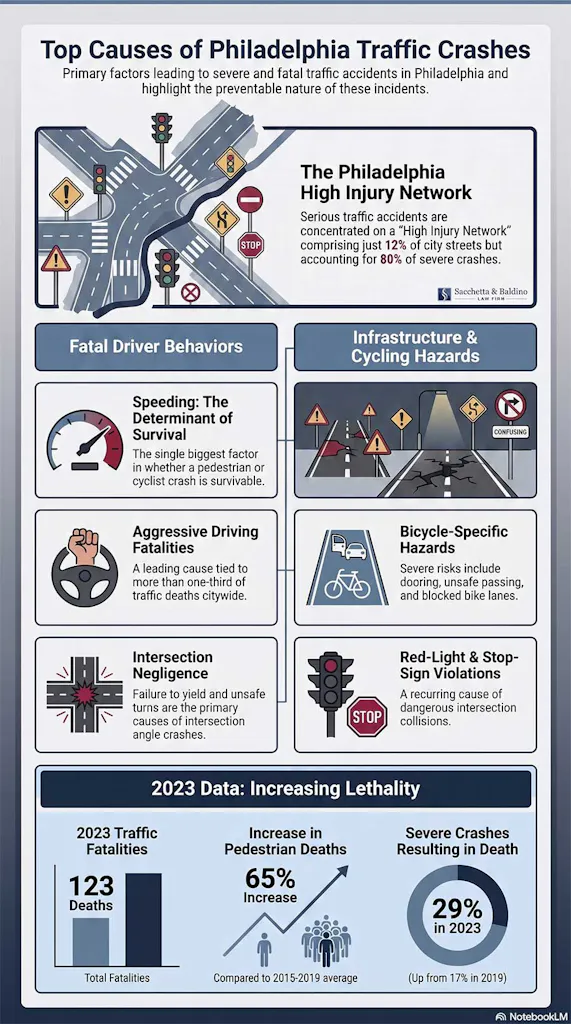
Pulling the data together, these are the most common causes behind Philadelphia’s serious and fatal crashes:
- Speeding — the single biggest factor in whether a pedestrian or cyclist crash is survivable
- Aggressive driving — a leading cause tied to more than one-third of traffic deaths citywide
- Failure to yield and unsafe turns — the primary cause of angle crashes at intersections
- Red-light and stop-sign violations — a recurring cause of intersection collisions
- Street design — a small share of streets, concentrated on the High Injury Network, causes a disproportionate share of severe outcomes
- Dooring, unsafe passing, and blocked bike lanes — causes specific to bicycle crashes
The Numbers That Matter Most
For a quick reference, here are the statistics that best summarize where Philadelphia’s traffic safety problem stands:
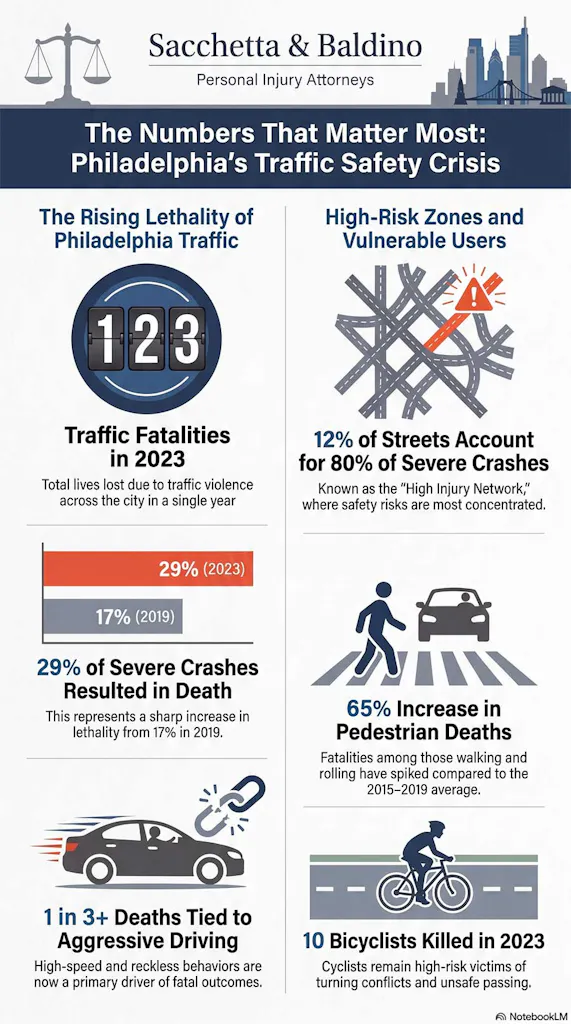
- 123 traffic fatalities in Philadelphia in 2023
- 29% of severe crashes resulted in death in 2023, up from 17% in 2019
- 65% increase in deaths among people walking and rolling, compared to the 2015–2019 average
- 12% of streets / 80% of severe crashes — the concentration defining Philadelphia’s High Injury Network
- 1 in 3+ traffic deaths tied to aggressive driving
- 10 bicyclists killed in Philadelphia in 2023